Figure WORKERS
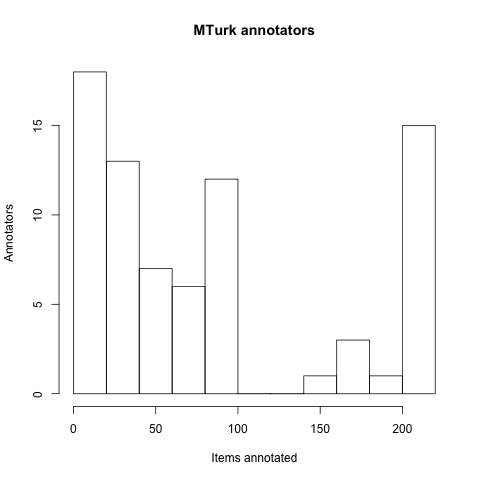
Information on the MTurk annotators.
15 workers did 10 items or fewer.
15 did at least 200, and 6 did all 215.
This section introduces an experimental dataset involving 215 indirect question–answer pairs with annotation distributions attached to them. The data include a (semi-)random development/evaluation split, with 150 examples in the development set and 65 in the evaluation set.
I don't look at all at the evaluation set here. Some of you might want to do your own experiments with the data. If that happens, we can have a mini bake-off, to see who does better on the evaluation data. Thus, if you pursue your own experiments, stick to the development set for now.
Code and data:
Table COLUMNS gives an overview of the column values in iqap-data.csv.
| Column | Description | |
|---|---|---|
| 1 | Item | Item number |
| 2 | Classification | CNN, Yahoo, Hirschberg, Switchboard |
| 3 | Source | Source file where applicable, else repeats Classification |
| 4 | Question | question text |
| 5 | Answer | answer text |
| 6 | Prefix | 'yes', 'no' or blank |
| 7 | definite-yes | number of annotators who chose this category (0..30) |
| 8 | probable-yes | number of annotators who chose this category (0..30) |
| 9 | definite-no | number of annotators who chose this category (0..30) |
| 10 | probable-no | number of annotators who chose this category (0..30) |
| 11 | DevEval | DEVELOPMENT or EVALUATION |
| 12 | QuestionParse | Stanford parser parse, with hand corrections, of Question |
| 13 | AnswerParse | Stanford parser parse, with hand corrections, of Answer |
The file can be read into R:
Here, we limit attention to the development set:
Here are the first two lines of the data:
The experimental data come from a variety of sources. Table SOURCES gives a description.
| Source name | Description | Examples |
|---|---|---|
| CNN | From CNN show transcripts | 40 |
| Hirschberg | From Hirschberg 1985, many of which come from corpora | 26 |
| Switchboard | From the Switchboard Dialog Act Corpus | 26 |
| Yahoo | From highly restrictive regex searches over the Yahoo Answers corpus | 58 |
The dev/eval split is random except that the proportion of items from each of these categories is the same in the two sections (and thus the counts are CNN: 17, Hirschberg: 12, Switchboard: 11, Yahoo: 25). I did this because the data were collected in very different ways and pose different kinds of challenge, so it seemed worthwhile to ensure both development and evaluation contain similar proportions from each.
I went through the raw data and made adjustments where I thought that would deliver better results in the annotation phase and more focused experimental work:
The data were annotated on Amazon's Mechanical Turk. Each IQAP received annotations from 30 separate Turkers. Here is the prompt:
Indirect Answers to Yes/No Questions
In the following dialogue, speaker A asks a simple Yes/No question, but speaker B answers with something more indirect and complicated:
${Question}
${Answer}
Which of the following best captures what speaker B meant here?
B definitely meant to convey "Yes". B probably meant to convey "Yes". B definitely meant to convey "No". B probably meant to convey "No". Cautionary note: in general, there is no unique right answer. However, a few of our HITs do have obvious right answers, which we have inserted to help ensure that we approve only careful work.
Any comments would be very much appreciated:
This prompt differs from that of de Marneffe et al. 2010 in not containing an "Uncertain" option. That option turned out to be rarely chosen and difficult to interpret because it meant dealing with two kinds of uncertainty:
The current prompt removes the first kind of uncertainty. Where Turkers were uncertain of the right response, they were forced to make a choice. We can expect uncertainty to arise from the randomness of these forced choices.
Seventy-six Turkers participated in the annotating. Figure WORKERS gives some additional information about what the annotators did.
The level of agreement about the basic polarity (yes vs. no) of the answerer's intentions was very high: 70/150 item showed complete agreement, and 111/150 items showed agreement by at least 28/30 Turkers:
The entropy of the response distribution is another way of getting a grip on how much variation there was in the annotations overall. The following R function calculates this for an item row (you can paste it into your R window or else read it in from a file):
Next, we add a column giving the response entropy for each item:
Figure ENTROPY shows the distribution of response entropy values, generated by the following code:
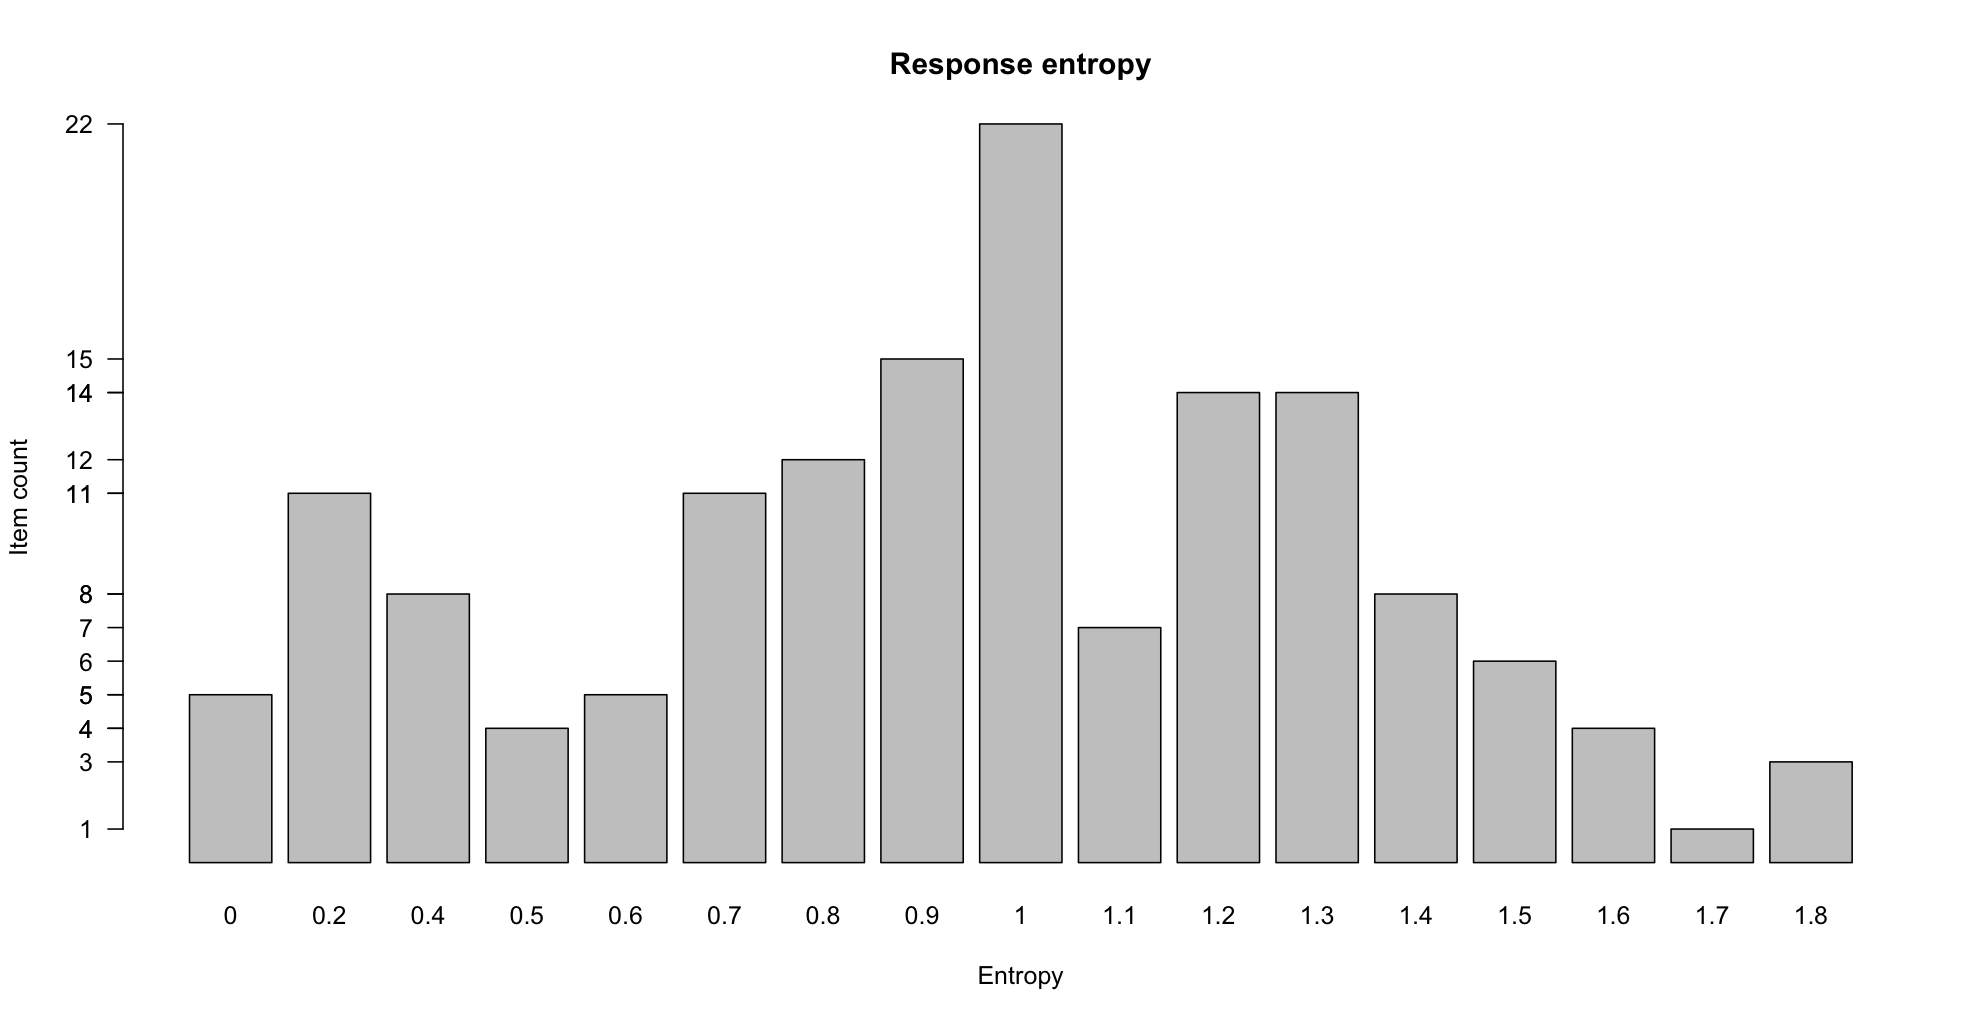
There are 6 items in the development set with perfect agreement in terms of responses (entropy = 0):
  Item                           Question                  Answer   Response
   118 Is the new judge really this good?            He is great.   definite-yes
   146              Did he do a good job?     He did a great job.   definite-yes
  2011              Do you like that one?              I love it.   definite-yes
  3064               Is a shark a mammal?    A shark is a mammal.   definite-yes
  3080        Is Cassandra a pretty name? It is a beautiful name.   definite-yes
And here are the items with the highest entropy (least agreement) in the development set:
Item                               Question                        Answer definite.yes probable.yes definite.no probable.no  entropy
4012       Have you read the third chapter?            I read the fourth.            3           16           2           9 1.597417
4034                          Are you sick?           I've got allergies.            3           10           2          15 1.620973
4031          Do you have italian dressing?          We have vinaigrette.            1            7           9          13 1.697340
2016 Did you buy a program to handle menus? It came with a menus program.            2            6          11          11 1.786315
3068                 Is zero a real number?          It's a prime number.            9           12           2           7 1.800212
2003     Do you want to go ahead and start?  I was hoping that you would.            4            4          10          12 1.832263
The Prefix column in the data contains either 'yes', 'no', or the empty string. The 'yes' and 'no' cases are those where the answer originally had this word as a prefix but I removed it before the annotation process. One might worry about this, or at least consider it when analyzing the data. Speakers might have chosen this item because they feared that the bare answer would create too much uncertainty, so removing it could artificially increase uncertainty. The present section explores this. My overall conclusion is that removing the prefix did not increase uncertainty.
For easy identification, a column for the prefixed items:
As discussed below, all but one of the prefixed cases are from the Yahoo section of the corpus.
Let's first check the relationship between the prefix value and the majority choice of the Turkers:
This looks really good: just one example has mixed polarity between the majority choice and the author's original prefix, and only one prefixed-example lacked a majority choice.
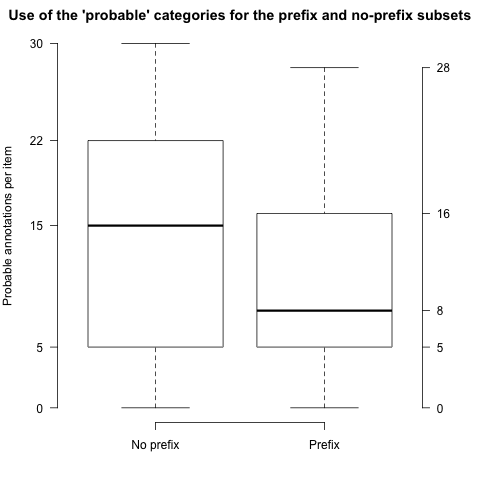
If removing the prefixes increased uncertainty, then we would expect to see increased use of the 'probable-yes' and 'probable-no' categories over their 'definite' counterparts. Let's see if that is the case
Figure PROB, produced by the following code, is a boxplot of the values. The picture suggests that, if anything, there is more use of the 'probable' categories when no prefix was present in the original, though the difference is small and it seems unlikely that it traces to this property of the examples. (It is more likely that it traces to something about the Yahoo portion of the corpus.)
We can check to see whether having a prefix correlates with response entropy:
Figure ENTDIST shows the output of this boxplot command. As before, the entropy for the non-prefix population is actually higher than it is for the prefixed one, which runs counter to our initial hypothesis:
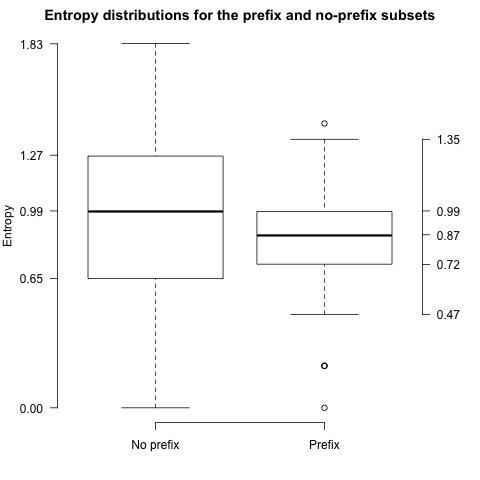
I conclude that, though the prefixing might be an important feature (especially internal to the Yahoo section of the corpus), it was not definitive in terms of the nature of the responses people gave.
I parsed the data with the Stanford Parser and hand-corrected the results. If you decide to do experiments that depend on the trees, then you might want to extend and make use of the following classes:
I also hand-annotated the questions and answers for something approximating the 'contrast' predicate. For example, in the simple dialogue Was the movie good? It was great., the words good and great would be highlighted. These annotations take the form of one or more nodes suffixed with '-CONTRAST'. The Python classes include functionality for grabbing these subtrees and working with their leaf nodes. The iqap.CorpusReader method view_contrast_preds() gives you a sense for what kind of information is available here. Here's a sample of the output:
exercise INTJ, exercise NEG, exercise PYENT
Let's look at the nature of the relationships between question and answer that the data include, on the look-out especially for implicatures.
I frame the discussion in terms of which predicate is stronger, the question radical or the answer. The notion of strength here is the flexible one that Hirschberg 1985 identifies — not just entailment, but rather something closer to communicative force.
Item                           Question                                Answer  definite.yes probable.yes definite.no probable.no
  92           Is the weather nice now?                    Beautiful weather.            27            3           0           0
 146              Did he do a good job?                   He did a great job.            30            0           0           0
1009                    Is it a comedy?          I think it's a black comedy.            14           16           0           0
3015   Is Cadillac an American company?    It's a division of General Motors.             7           22           0           1
2013  Are there poisonous snakes there?        We have a lot of cotton mouth.            14           14           0           2
3000                  Is chess a sport?            It is a sport of the mind.             9           19           1           1
Entailment: the "yes" is not an implicature, but rather a contextual entailment. That is, since one cannot consistently agree that the job was great but deny that it was good, we needn't reason in terms of the maxims in order to arrive at the "yes" answer for a case like that.
Implicatures: the answerer conveys that there is something inappropriate about simply affirming the question predicate.
Item                           Question                                Answer  definite.yes probable.yes definite.no probable.no
 122   Do you think that's a good idea?                 It's a terrible idea.             0            0          29           1
3067            Is Santa an only child?          He has a brother named Fred.             1            0          24           5
Entailment: the "no" is not an implicature, but rather a contextual entailment arising from the lexical semantics of the predicates involved and a very general notion of speaker commitment.
Implicatures:
Item                                        Question                             Answer  definite.yes probable.yes definite.no probable.no
2014              Did you get any information on it?        I sent off for stuff on it.             0            4          23           3
3081                       Is it a sin to get drunk?    It is a sin to drink to excess.            13           14           1           2
4000 Did you manage to read that section I gave you?  I read the first couple of pages.             0            6           6          18
4016                               Do you need this?                         I want it.             2           15           0          13
Implicatures: here, "no" is often an implicature. Informally, we can reason as follows:
Item                           Question                                Answer  definite.yes probable.yes definite.no probable.no
4024   Have you mailed that letter yet?               I haven't proofread it.             0            0          25           5
4007               Did you buy a house?     We haven't gotten a mortgage yet.             0            2          16          12
Entailment: here, "no" is arguably a contextual entailment. The answer conveys that a precondition for the truth of the question radical has not been met.
Implicature: the over-answers can help to avoid inferences on the part of the questioner about how close or how far reality is from the question being true.
Item                               Question                                Answer  definite.yes probable.yes definite.no probable.no
2020           Do you know how to spell it?                   It starts with a K.             0            6           4          20
3048    Is America an imperialistic nation?      It's a representative democracy.             1            2          10          17
4001  Have you made fondue in this pot yet?                 Not chocolate fondue.             1           19           1           9
4006                   Do you speak Ladino?                      I speak Spanish.             1            9           4          16
4012       Have you read the third chapter?                    I read the fourth.             3           16           2           9
4032                     Do you have paste?                We have rubber cement.             0            8           4          18
Implicatures: the answer is typically rich in implicature concerning "yes" or "no", because of the pressures of relevance. Determining which enrichment is appropriate can be challenging.
In class on July 12, the class broke up into groups and formulated questions and hunches about the IQAP data, focussing on patterns that might be relevant for building predictive models of the response distributions.
The next few subsections give my (partial) responses to these questions. I've used a mix of Python and R code, playing to the strengths of each and also aiming to further illustrate how the classes in iqap.py work.
As discussed above, about 20% of the examples originally had a 'yes' or 'no' prefix on the answer, which I removed before annotation. The analysis of this section suggests that this did not have a systematic effect on the annotation choices people made.
In exploring the prefixes, I neglected to address a basic question about them: are they evenly distributed across corpus types? The answer is that they are not; all but one of them comes from the Yahoo part of the corpus, as the following analyses show.
This imbalance is likely an artifact of the way the data were collected. It suggests that we might do well to re-mine the other sources for additional prefixed-answers, which could then be included in an expanded data release.
R:
Python:
This one stumped me! I don't see a way to test this comprehensively without classifying the examples by hand or relying on the models developed on this page. All I can say now is that the definite-yes's clearly dominate in this small sample!
The group that proposed this pointed out that there are a number of ways it could be addressed. Here, I treat it as a simple problem of lexical overlap. A more sophisticated approach might compare the tree structures (including or excluding their node labels and/or lexical items). For a survey of relevant algorithms, see Brille 2005.
I did this as a mix of Python code and R code: Python to generate the CSV file, and R to plot the contents of that CSV file. This seemed like the path of least resistance: NLTK/Python is excellent for working with language data, and R is excellent for visualization.
I then plotted this quickly in R; the results don't look promising, but perhaps this just indicates that the relevant notion of similarity is less lexical than lexical_overlap() construes it.
There were a few variants of this question in class, involving attitude predicates, modals, hedges, additive particles, and exclusive particles.
The following code seeks to provide general functionality for addressing these questions using regular expressions. More sophisticated approaches would use the tree structure as well.
The R code produces a boxplot:
I don't want to deal with creating a boxplot in Python, so I'll take a slightly more abstract approach for the Python version, by relating regular expression matches to majority responses:
This question is on sound theoretical footing — Hirschberg (1985 §5) discusses similar patterns. However, I don't see how to test it computationally. I suppose we need a morphological parser that can isolate tense marking.
The group that posed this question addressed it by studying how the entropy of the response distributions changes as we group the categories in these two ways.
I did this experiment in R, by generalizing the code above for calculating response entropy. The code looks rather involved, but it just calculates entropy for three kinds of distribution, adds the values to the iqap frame, and creates box-plots of the results for initial study.
Figure ENTCMP provides the boxplot, which we might refer to later on when we think about the experimental results:

MAJ In discussing the relationship of prefixing to the majority choice category, I extended the iqap table with a column of values indicating which, if any, is the majority choice. Calculate the majority distribution using xtabs and plot it using barplot. Are there any patterns or imbalances that we should be aware of?
CLASS What is the relationship between the majority choice category and Classification values. Use xtabs and barplot to study the relationships. What experimentally relevant information does this analysis provide?
PROBEX The section on relating prefixing to categories choices suggests that there is a difference between the prefixed and unprefixed classes with respect to use of the 'probable' categories. Is this difference reliable? To test this, use hist to check on the distribution of probable values for the prefixed and unprefixed subsets. If the results look normally distributed, then use t.test to probe what the contrast is like. If the results seem not to be normally distributed, use wilcox.test.
ENT The section on relating prefixing to response entropy suggests that there is a difference between the prefixed and unprefixed classes with respect to the entropy of the response distributions. Is this difference reliable? As in the previous problem, first check the distribution of values using hist and let this guide the statistical test you use.
INTJ This question relies on the iqap.py classes. The following function identifies whether an item's answer is interjection initial.
Use this function to study the relationship between interjections and response distributions. Are there any patterns that we might exploit in predicting response distributions?
The following code gets this started by providing the relevant looping structure:
NEG Negation is likely to be important. Write a function, akin to interjection_initial_answer above, that determines whether the contrast predicate in the answer is negated. (The Item method answer_contrast_pred_pos() grabs all the (word, tag) tuples from the -CONTRAST predicates.)
PYENT Extend the iqap.Item class with a function that calculates the entropy of the response distribution. The R code here is a useful model, I think, but you can find others on the net.
INDY The section The question radical and the answer seem to be independent identifies a reliable implicature of such answers. Provide a general Gricean derivation of this implicature.
IMP Some of the examples in The question radical and the answer seem to be independent have majority 'yes'-type answers and other majority 'no'-type answers. Pick one of each kind and state a set of contextual assumptions (one might suffice) that, if included, would likely reverse the annotators' judgments about the answer's intentions.
Home
 This work is licensed under a Creative Commons Attribution-NonCommercial-ShareAlike 3.0 Unported License.